

Data is only as useful as the factual stories it can tell. For people to be able to evaluate and create data-driven stories, they need to understand the fundamentals of how data is used, who uses it, and when to trust data-driven arguments. Open Data/Open Minds (ODOM) supports the development of this fundamental understanding through visualizing and personalizing data with paper, craft, and computation.
The work reflects our commitment to open data and supporting data literacy as a competency for communities – we see it as part of an emerging civic infrastructure for education. Working with craftsperson and CS instructor Natalie Freed, we’ve prototyped a series of a connected notebook projects using wifi and wireless dev boards from Particle.io and Adafruit.com.
It's notable and inspiring - as a model of collaboration and iteration - that Natalie has been hands-on and directly responsible for all the builds on this page. From our first collaboration with her on Program Your Pages, Working with Microcontrollers in the Hack Your Notebook series, to her beautiful, hand-made book, the "Tidal Notebook," to the list of builds you'll find below, Natalie has been a source of inspiration and ingenuity for each of them. Look her up. You'll be glad you did (see: nataliefreed.com).
Tidal Notebook
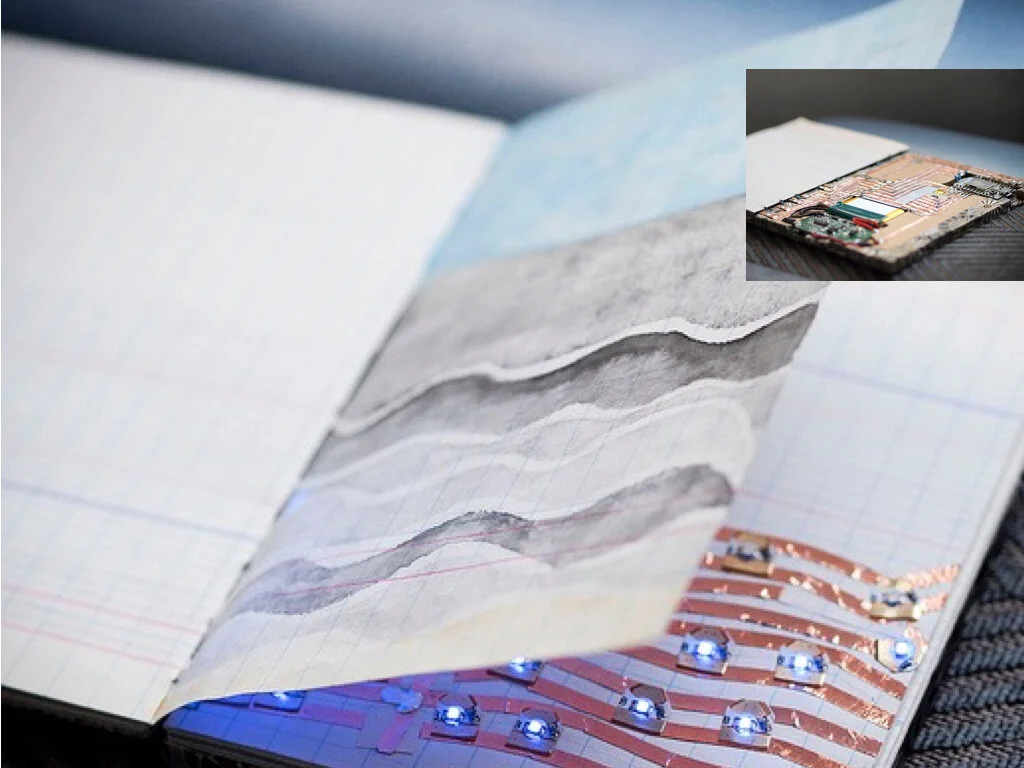
Tidal Notebook: a handmade, connected notebook and journal by Natalie Freed.
The Tidal Notebook, our first demonstration of paper, electronics, data, and connectivity, records the height of the tide at the Golden Gate Bridge in real-time, pulling information from the internet into a handmade journal and notebook. A set of parallel circuits register the height of the tide (one row for low tide, up to five for high tide) whenever the circuit system — and the notebook — is on a network.
Read about it in a pair of of blog posts from NEXMAP’s first project manager and learning designer Jennifer Dick. Here she describes the making of the Tide Notebook and here Jen documents her own hacking with a rechargeable battery from a mobile phone.
There are many ways to create alerts and notifications — and re-create the automation on our phones and devices. As Natalie put it when were were thinking through the approach to the proof-of-concept, thinking about how to isolate and make precise specific ideas and details one can track on the web: "What would happen if you could pull the internet into your notebook?"
Handmade book by Natalie Freed. Topic: San Francisco Bay, including maps, reflection, design ideas, technical instructions on the use of the Spark Core from Particle.io; the height of the tide is pulled from NOAA.gov and a monitoring station just north of the Golden Gate Bridge.
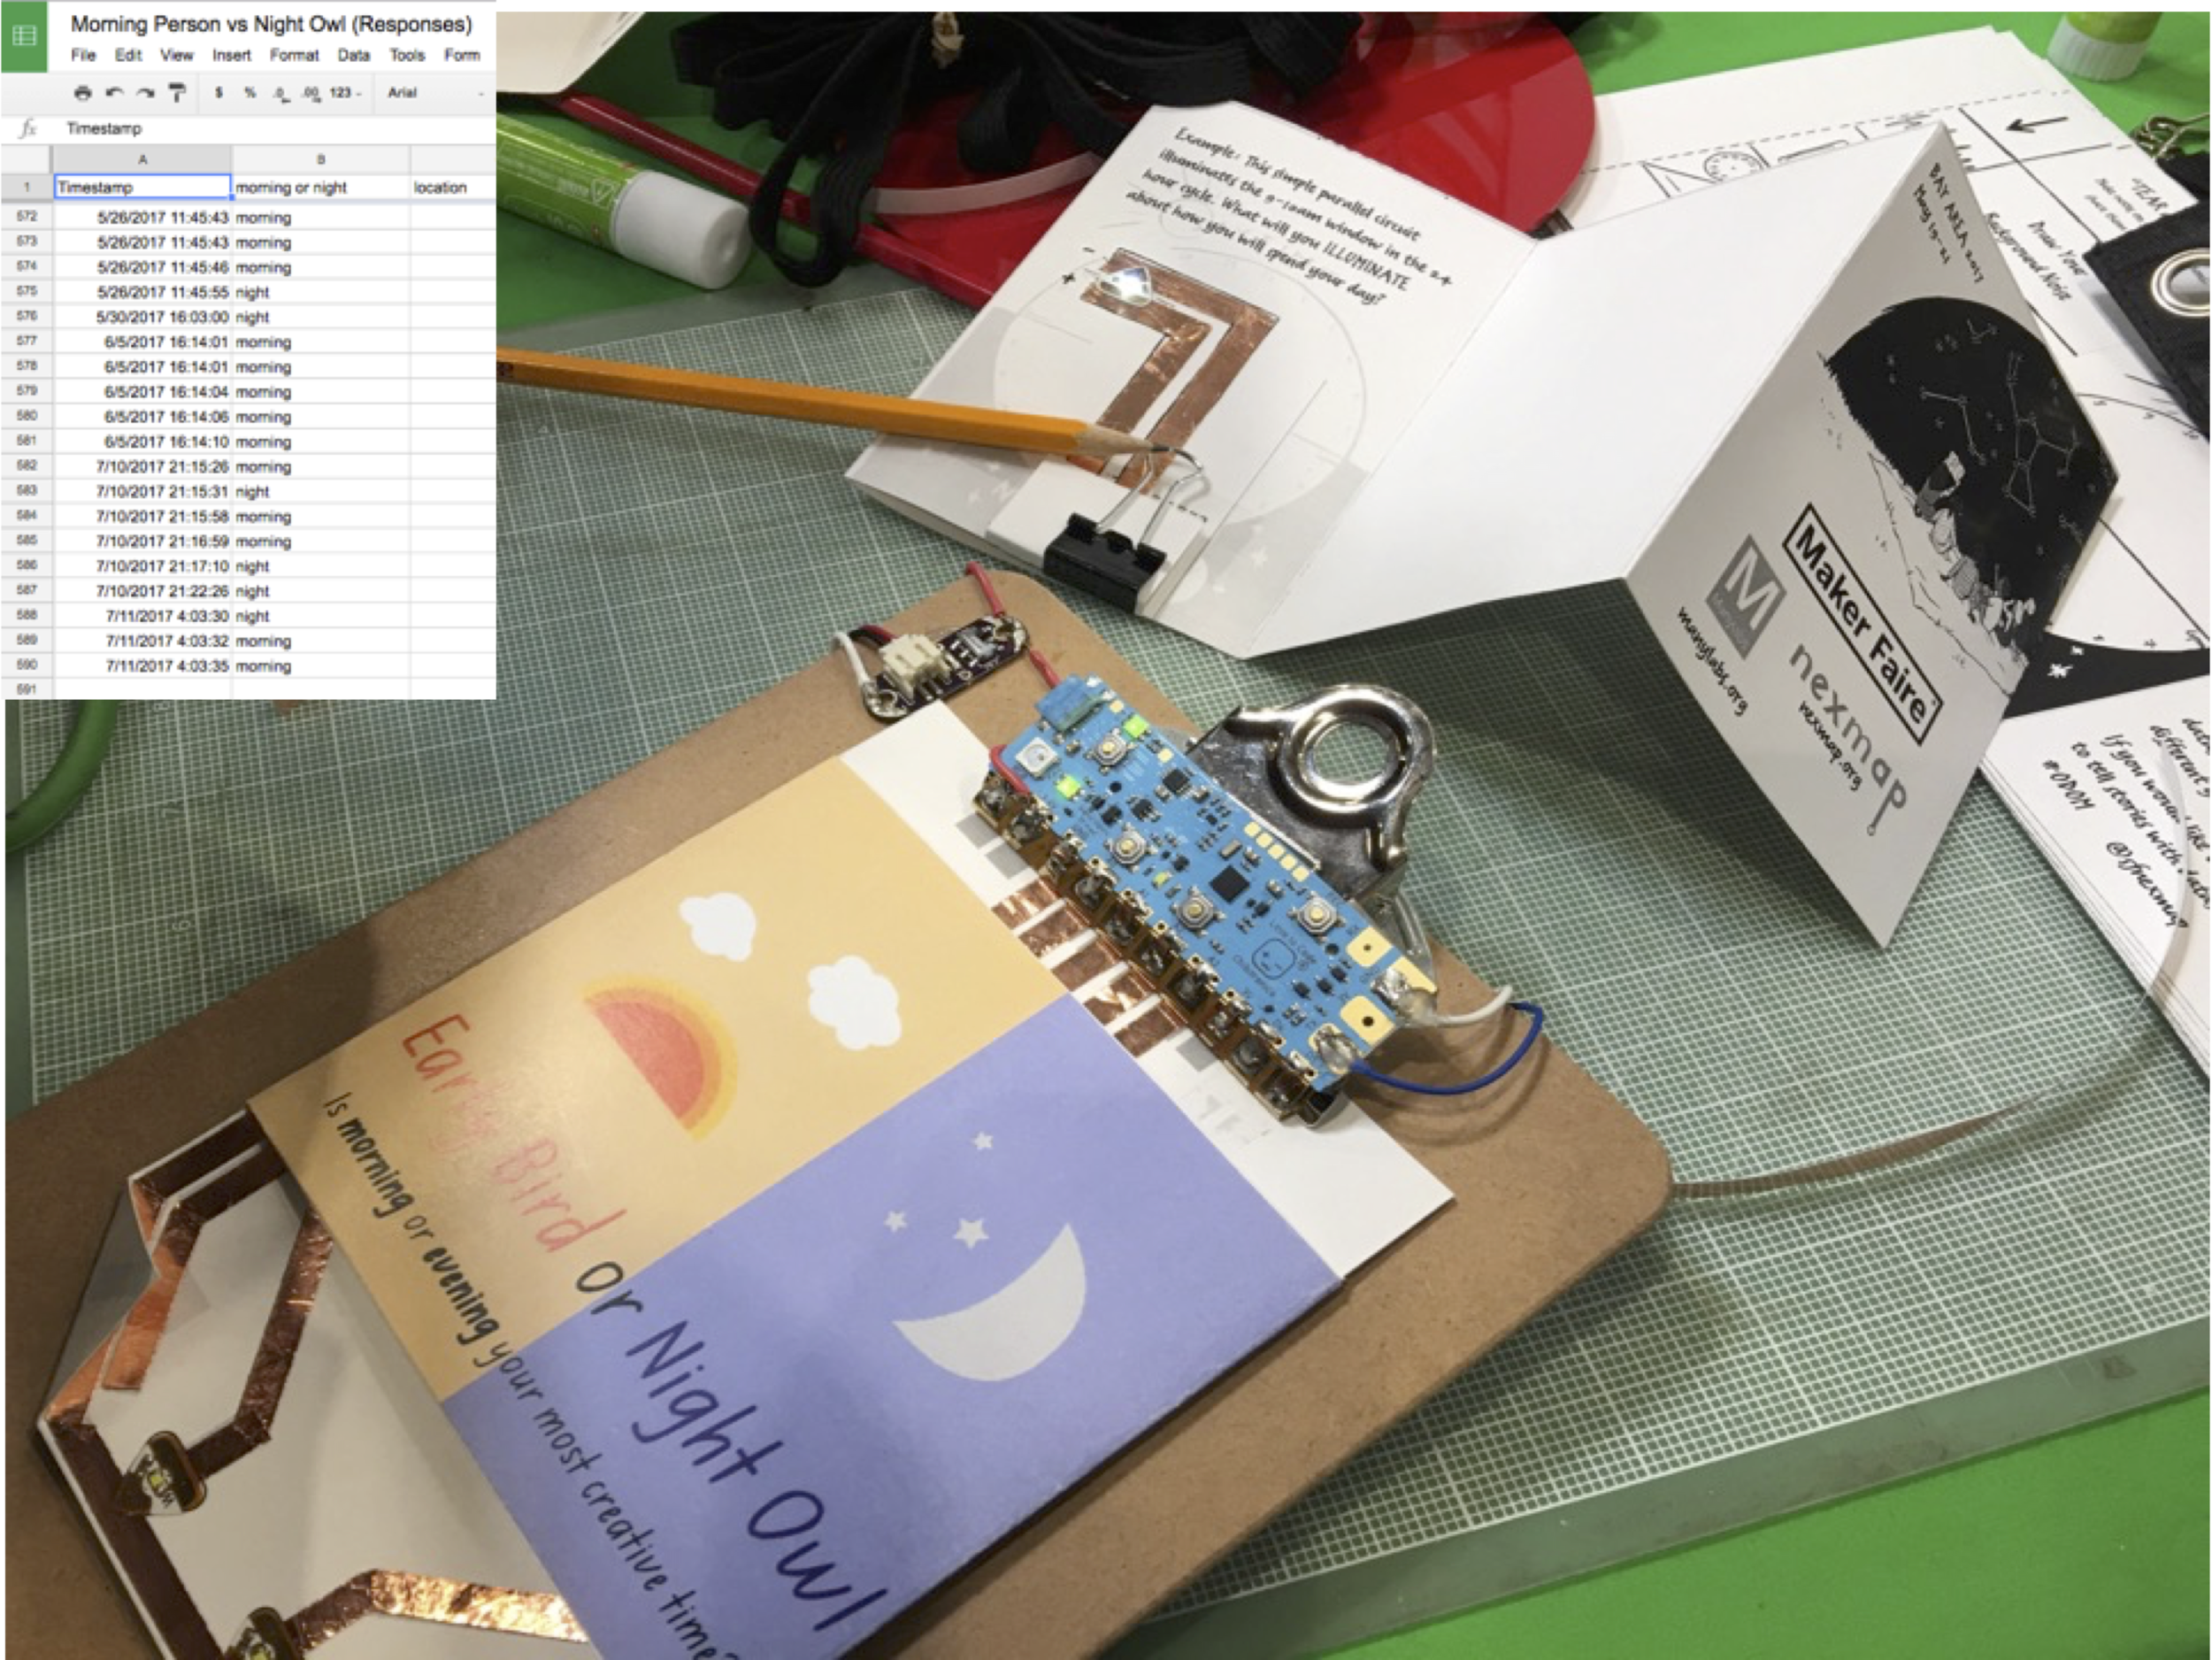
Early Bird or a Night Owl? When are you most creative? A poll developed for our work with the Fluency Project at Carnegie Mellon’s CREATE LAB and shared at Bay Area Maker Faire 2017.
Data Gathering with Connected Paper
Proof-of-concept
Our work on data literacy led us to this proof of concept for paper as an input interface to support the development of problem statements, research protocols, and the integration of craft with edtech, and applications to support visualization work and physical computing.
Building on the skills and understanding in the Hack Your Notebook series, here a circuit system on a paper template is used to gather binary, observational data. Results are collected in a Google Sheet. In addition to the Particle Electron for wireless connectivity, we use Chibitronics Chibi chip and its flex PCB to carry signal and maintain contact between the paper and the electronic components.
City Dashboard
Crafting Local Data Stories
The prototype work below pulls public feeds into a pop-up format. This version for Austin, TX displays temperature, time of day, traffic levels downtown, and AQI. Curiously, information on pollen levels — heavily documented and a major concern for Austin residents — was not available for integration through an open API. Why would that be? These are the kinds of questions we want to address and explore with Open Data/Open Minds.

Left: Pop-up mechanics, LED setup for temperature values, and wireless connections via Particle Electron. Center: Draft illustration of culminating project (with LEDs, pop-up and servo) for the city of Portland, OR in Hack Your Notebook #4 Automate Your Ideas, Working with Servos. Right: Pre-assembly for Austin, TX data dashboard with Congress St. bridge in the foreground.
Moz Open Leaders Program
NEXMAP at Mozfest, London, October 27-29
This fall David Cole and Elisabeth Sylvan were accepted for Mozilla’s Open Leaders Program, “a cohort of project leads fueling the Internet Health Movement.” Participants receive mentorship and training through the Mozilla Network in a 12-week online program on working open. Open Data/Open Minds is our lead project — we’re thrilled to be part of the program. Follow us on twitter @sfnexmap for updates from Lis from the festival. She’ll be on site at Ravensbourne in London sharing the work in talks, gallery sessions and demonstrations. Learn more about the the project on our github page.
"Scratch Paper" DIY Prototype and API Integration for Open Data
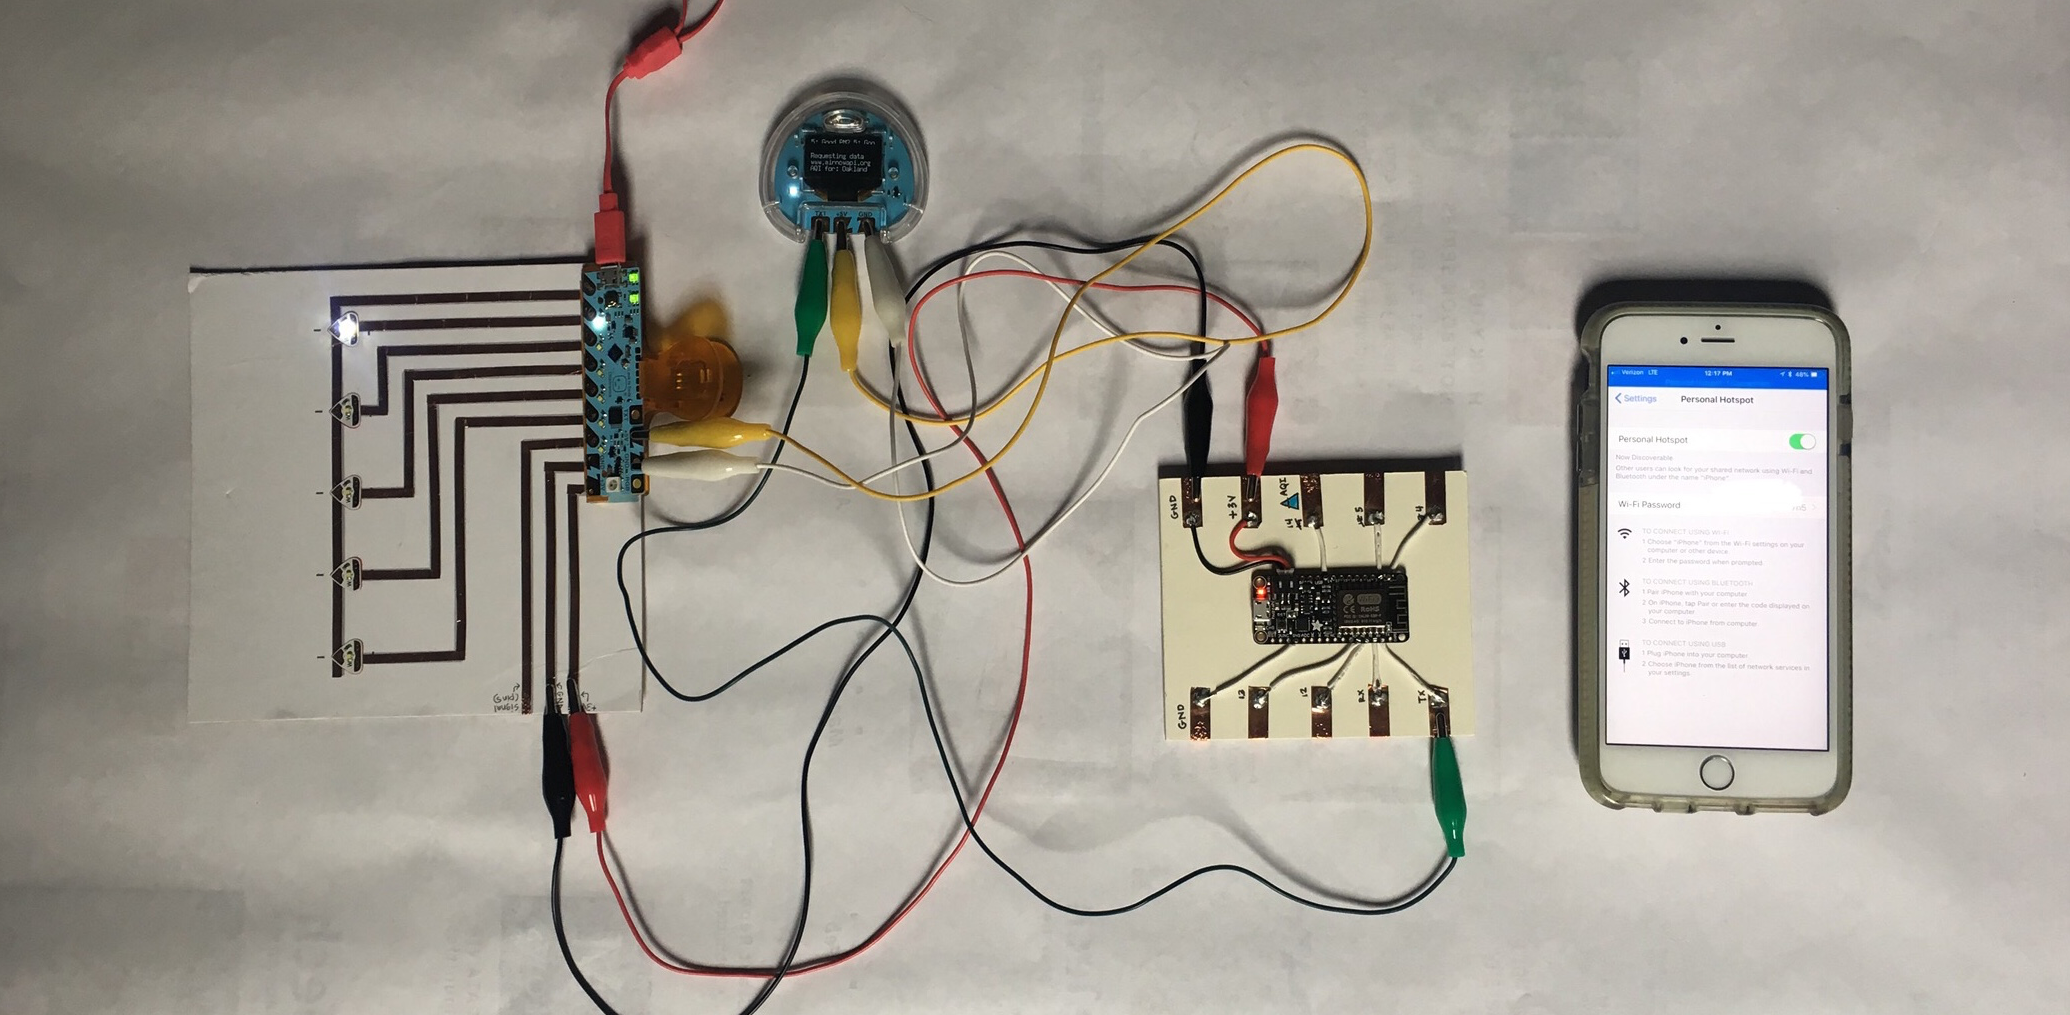
The setup above processes a live data feed from AirNow.gov for air quality in West Oakland in the 94615 zip code. The simple paper circuit on the left represents range values for a low-to-high "bar chart," with one LED representing "good" air quality and five LEDs illuminated equalling a "hazardous" readout.
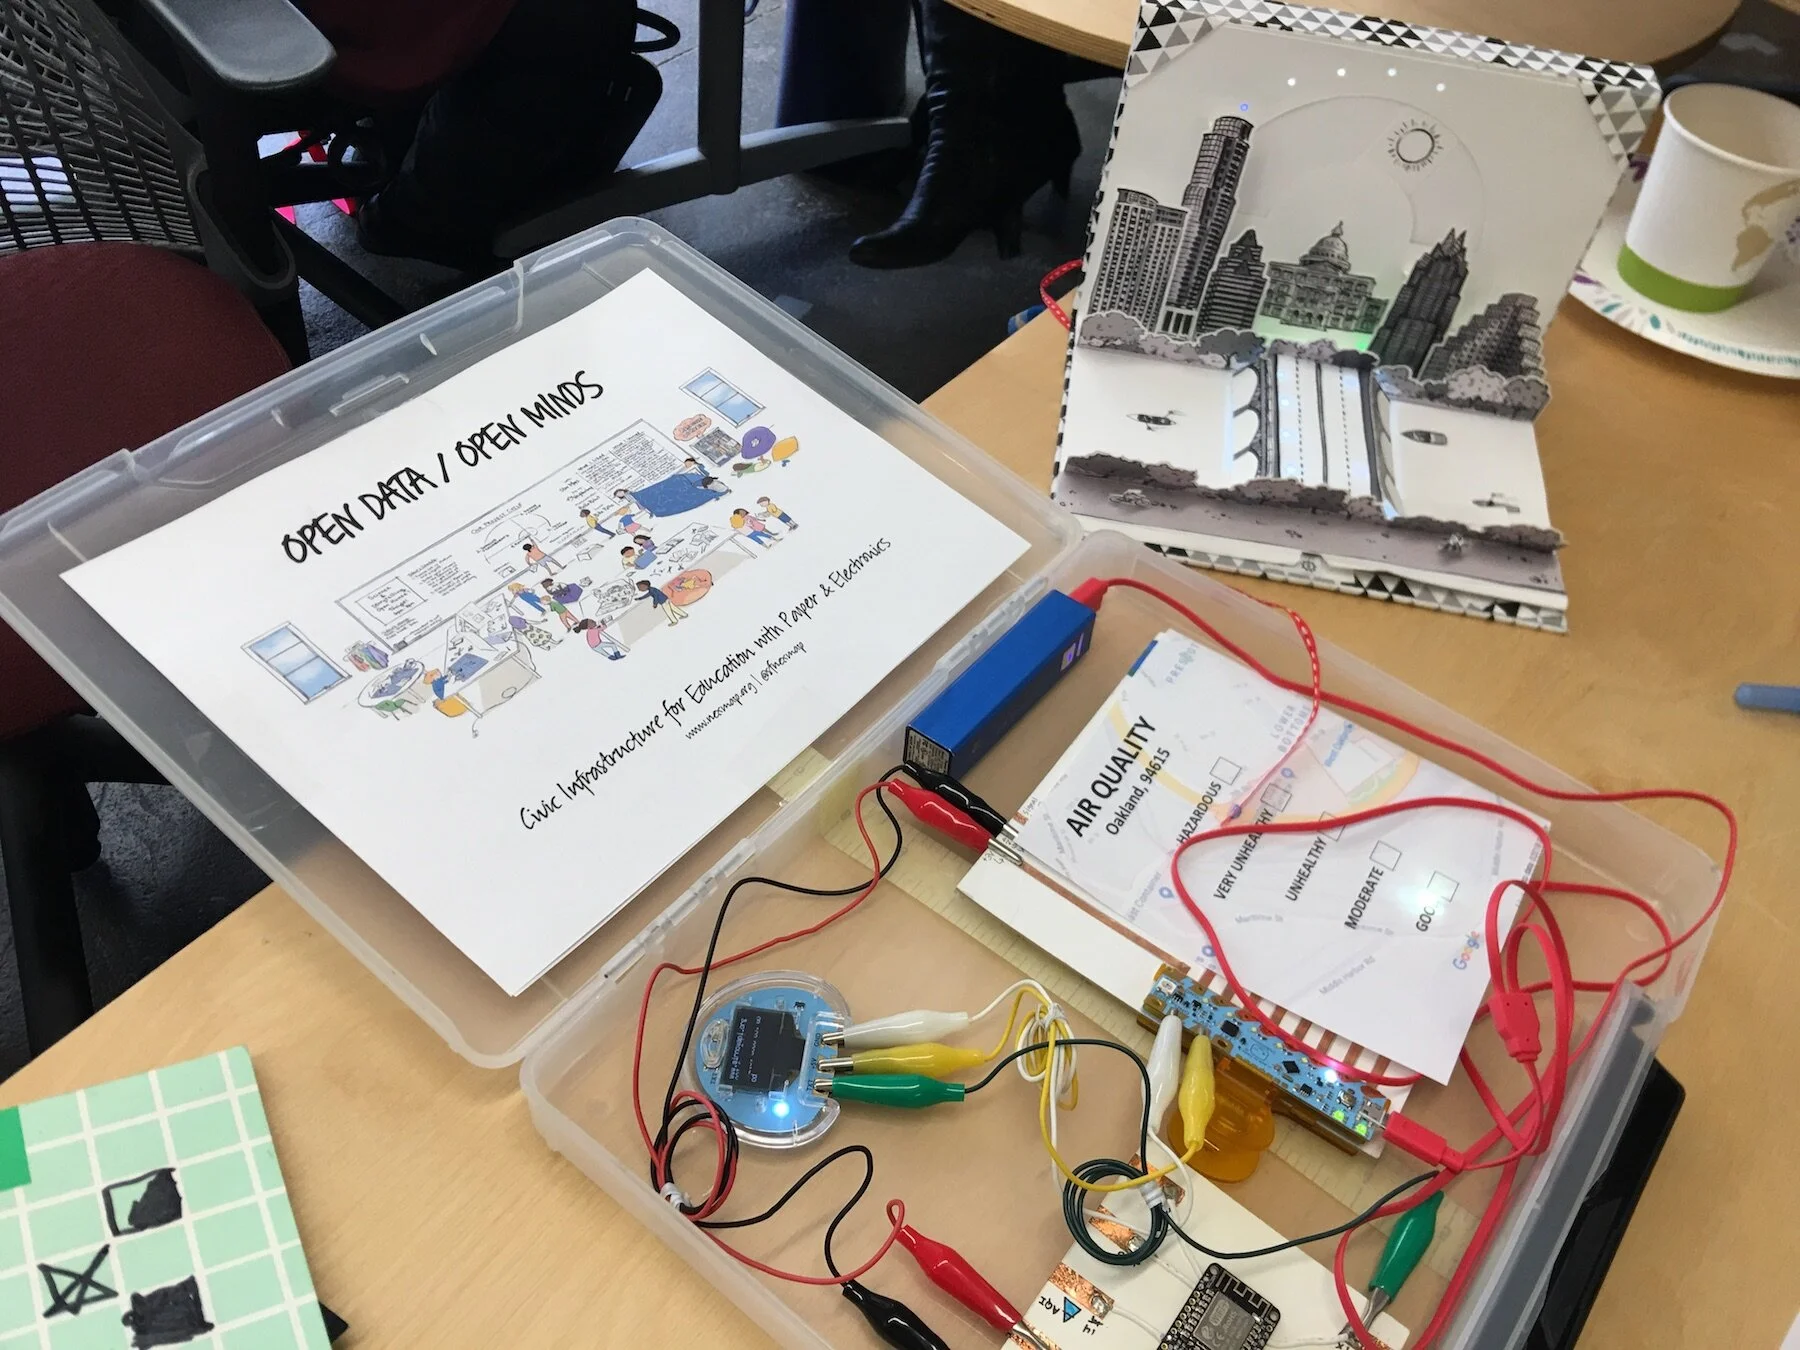
Demos w/Scratch Paper & Austin Data Dashboard at a CivicMakers meetup in San Francisco, 10/18.
The full kit here includes: 1) a microcontroller board, the Chibi Chip by Chibitronics, for programming and displaying an array of LEDs; 2) a Chibi Scope for serial readout of text information from AirNow.gov, providing real-time "screen" display via their API; 3) a wifi Arduino board from Adafruit, their "Feather" board, carrying the code for reading the "94615" zipcode detail from Airnow.gov; 4) a phone for tethering wifi connectivity to the build. Power is provided via the Chibi Chip and a USB cable connection to a power source.
Think of this as a deconstructed circuit system that's exposing elements of a basic IoT system, which are often "black-boxed." Next steps include: designing activity sequences and complementary paper circuitry templates, building a simple browser-based tool for authenticating a phone and a tethered connection to the wifi board, and interface features for selecting a dedicated data string by topic and location from a public data sources — so learners can create their own crafted and personalized local displays.

Engaging Teens to Tell Local Data Stories with Paper and Electronics
Data Navigators at Providence Public Library
Providence Public Library (PPL) worked with trainers and learning designers at NEXMAP and Chibitronics to develop a teen-focused paper circuit data visualization activity to complement an ongoing PPL data literacy and workforce readiness initiative. Supported by Civic Switchboard, the Pittsburgh-based took a unique approach to data literacy by promoting hands-on learning as a complementary strategy for sharing introductory data experiences with hard-to-reach audiences. The library hopes to apply this workshop model, blending hands-on, materials-based explorations with 21st century tools and skill-building, in additional learning settings with community partners.
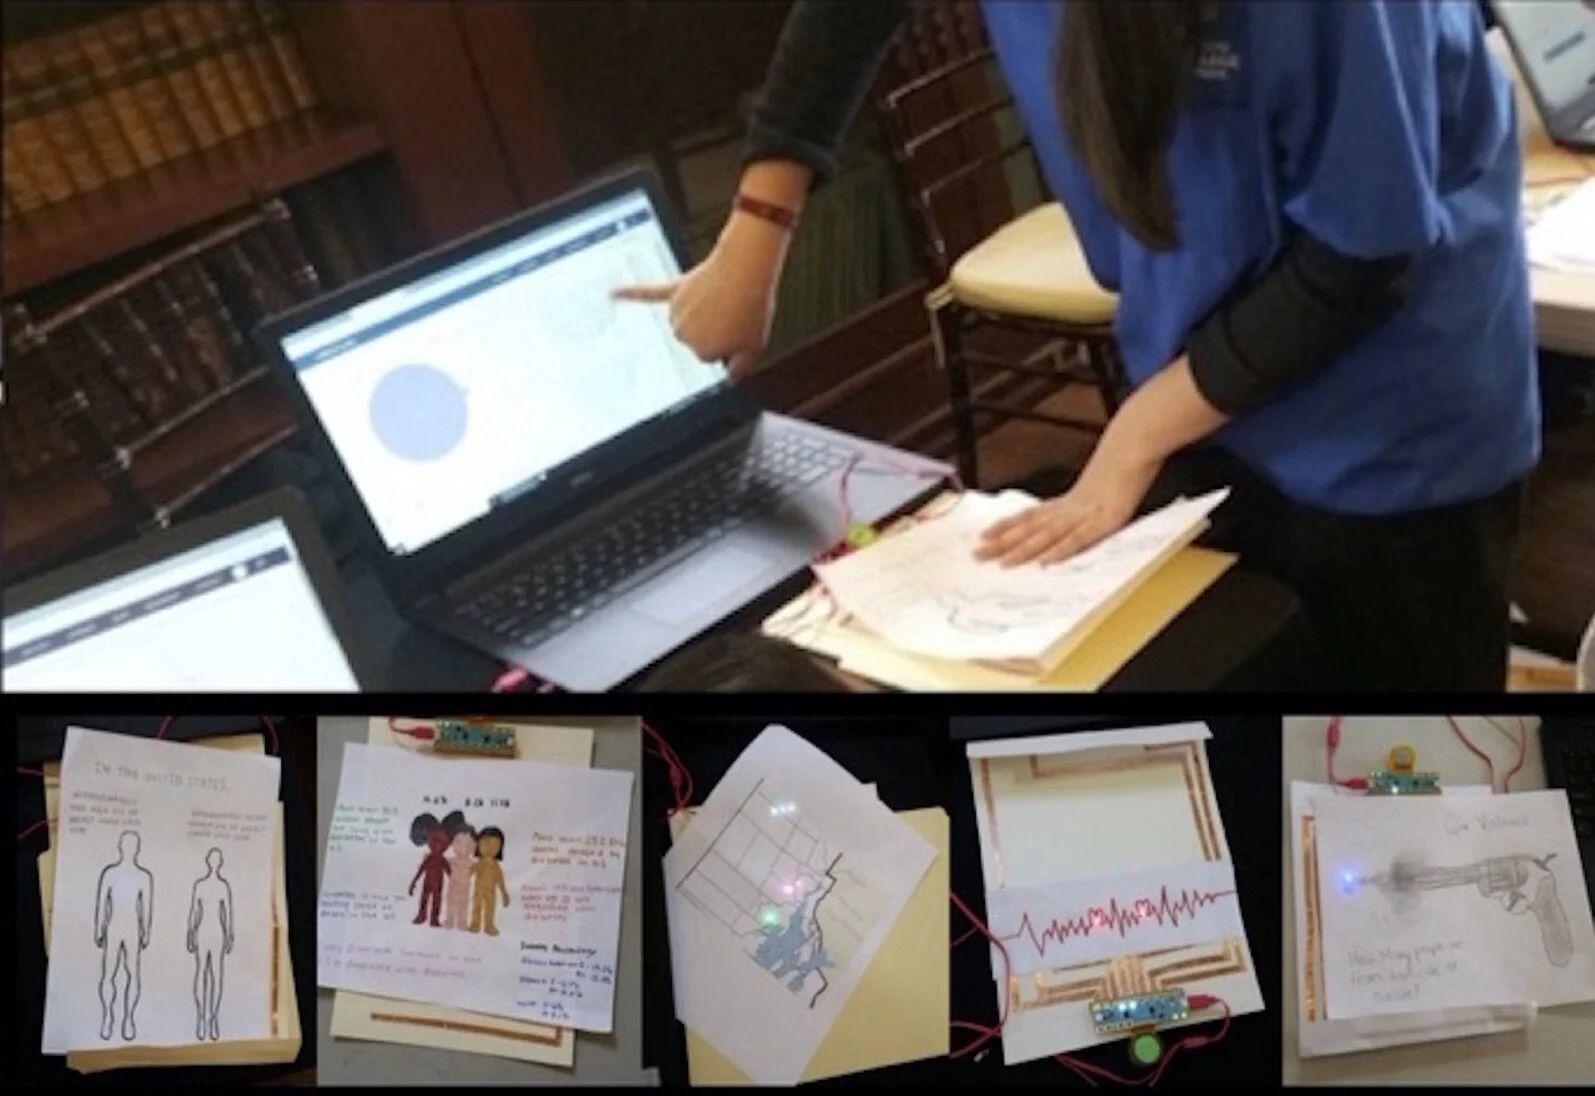
The workshop session — sponsored in part by Civic Switchboard, an IMLS-supported initiative to build awareness around the use of data and develop local, open data ecosystems with libraries and community partners — developed a “push-in” activity for the introductory course on Tableau offered in PPL’s Data Navigators 2.0 program. Activities centered on a supplemental making activity using craft materials in the form of paper, copper tape, binder clips, pens and markers, along with electronics from Chibitronics (circuit stickers and a “Chibi Chip,” a programmable microcontroller board) to make data explorations more accessible and translatable for learners new to data encounters (see the Civic Switchboard case study writeup for more detail).

“What we found with the groups in Providence, where making and physical computing were completely new ideas, is that the simple set of materials allowed participants to be playful and articulate what they were seeking to share. Calculations and decisions about how to contextualize information so it could be read in an output and interaction on paper – a blinking LED and a switch, say – turned into useful exercises at reverse engineering a kind of word problem. How shall I use a light to render a mortality rate for a given region? What’s my blink rate for what period of time? What’s the division and arithmetic I need to get a number and an output that’s meaningful?”
From: Getting Lost and Unlearning Certainty: Material Encounters in an Electronic Craft Practice
Critical Maker Reader, Institute of Network Cultures, 2019
chapter co-authored by David Cole and Hannah Perner-Wilson
editors Loes Boger and Letizia Chiappini